opal AT lists.psi.ch
Subject: The OPAL Discussion Forum
List archive
- From: "Alba Jacas Arnau (PSI)" <arnau.albajacas AT psi.ch>
- To: "opal AT lists.psi.ch" <opal AT lists.psi.ch>, "Snuverink Jochem (PSI)" <jochem.snuverink AT psi.ch>
- Cc: 'Fazel Taft' <fazeltaft AT gmail.com>
- Subject: Re: [Opal] space phase
- Date: Fri, 16 Sep 2022 12:22:18 +0000
- Accept-language: en-GB, de-CH, en-US
- Authentication-results: mc1; iprev=pass (psi-seppmail1.ethz.ch) smtp.remote-ip=129.132.93.141; spf=pass smtp.mailfrom=psi.ch; dmarc=skipped
Dear Fazel,
In addition to what Jochem mentioned, if you want to read the .h5 files in Python you can use something like this
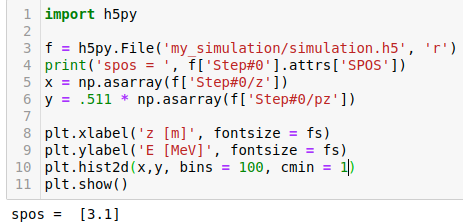
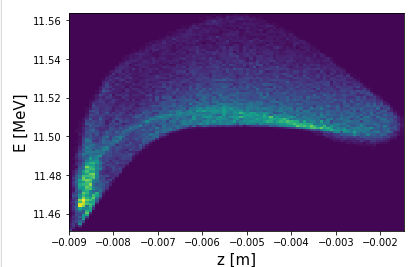
Then you can see the full longitudinal phase space.
Maybe this also answers your other email? I'm not sure what you meant by "getting the curvilinear system". All the information available is either in the .stat or .h5 files.
Hope this helps.
Best,
Arnau
Sent: 15 September 2022 17:33:55
To: opal AT lists.psi.ch
Cc: 'Fazel Taft'
Subject: [Opal] WG: space phase
Dear Fazel,
I forward your question to the OPAL mailing list.
I believe it should be possible to draw the same result with pyOPALTools. Probably the .stat file should contain all the information you need?
http://amas.web.psi.ch/opal/Documentation/master/#sec.opalt.opalt-output explains the columns of the stat file. For the first plot you could use energy spread (column 40) vs path length (column 2).
Best wishes,
Jochem
Von: Fazel Taft <fazeltaft AT gmail.com>
Gesendet: Donnerstag, 15. September 2022 14:04
An: Snuverink Jochem (PSI) <jochem.snuverink AT psi.ch>
Betreff: space phase
Dear Dr.Snuverink
I am working on a linear accelerator project and using OPAL for designing beam dynamic.
I upload my files such as : OPalceli.in , and twe electric fields : OPLAlEZtab1 and 3
By only working on it I have some parameters in the ".stat" file but I'm not able to look at the ".h5" file. I know the pyopaltools but the result I need to have access to phase space in the longitudinal direction.
on top of that I am using Dynac (cern) code , I attached the result of this program. How can I get the same result from OPAL . is it possible to draw this result by PYOPALtoos? If yes who?
could you help me to have better access to the input file.
best wishes
-
[Opal] WG: space phase,
Snuverink Jochem (PSI), 09/15/2022
- Re: [Opal] space phase, Alba Jacas Arnau (PSI), 09/16/2022
Archive powered by MHonArc 2.6.19.